The following post is to help you monitor your ESX/ESXi environment with OMS.
- First, you will need to enable the ESXi Shell, or SSH on your ESXi host, see HERE how
- Next, you will need to configure the syslog(s) on your ESXi host, see HERE how
My ESXi server’s IP 10.10.10.30, and I will be forwarding the syslog(s) to my vCenter Windows Server IP 10.10.10.34. To be safe, I am going to configure both port 514 UDP and TCP .
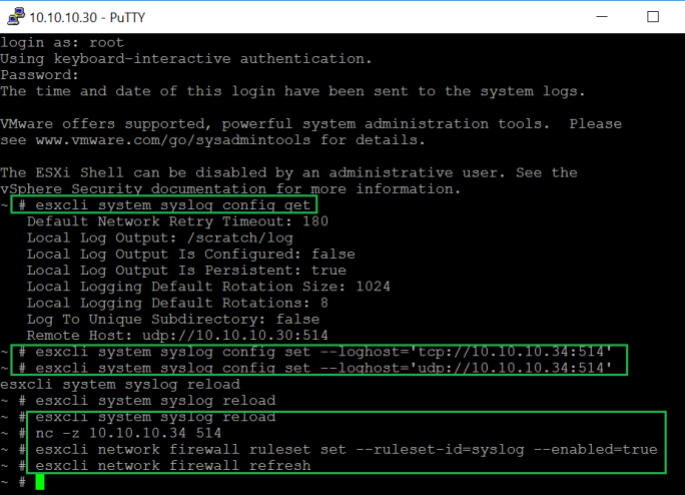
- Remember to disable the firewall(s) on your vCenter Windows server
- Now on your vCenter Windows Server, you will need to deploy the OMS Agent (Microsoft Monitoring Agent), see HERE how
- Once your vCenter server is communicating with OMS, we can move on to the next step
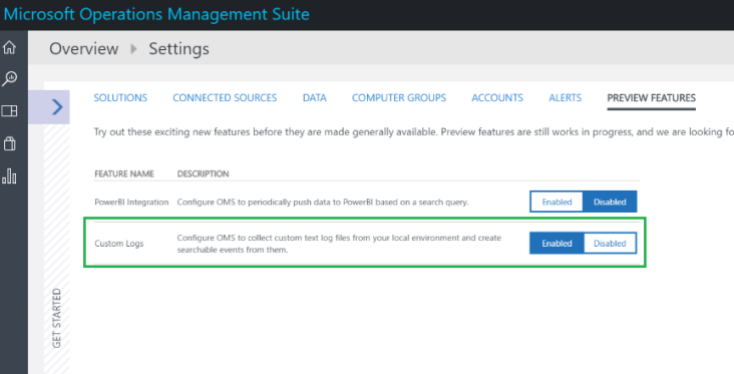
- Within OMS, if you haven’t already, you will need to enable “Custom Logs“; Settings > Preview Features > Enabled Custom Logs
- Next, set up the following syslog file as your custom log on your vCenter server. In my case, my ESXi hostname is ‘RaviESXi’ and its IP is 10.10.10.30.
- Followed by importing your syslog into OMS for the first time (see below for instructions)
“C:\ProgramData\VMware\vCenterServer\data\vmsyslogcollector\yourESXiHostnameHere\syslog.log”
For me, that path translates to, “C:\ProgramData\VMware\vCenterServer\data\vmsyslogcollector\RaviESXi\syslog.log”
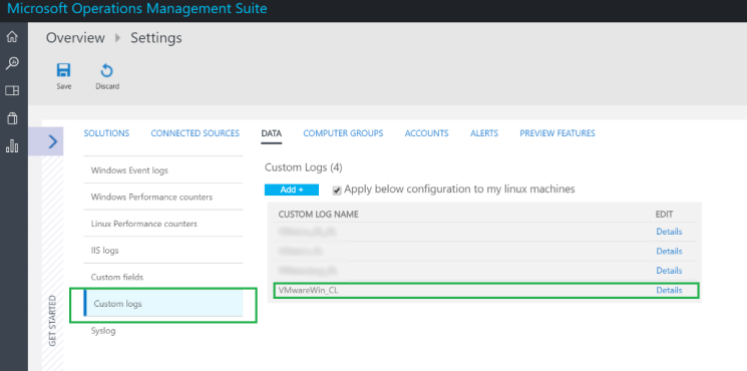
In my example, I then created an OMS custom log named “VMwareWin” for ESXi syslog. (By default, _CL suffix will be automatically added, which will result as, “VMwareWin_CL”) If you are unfamiliar with OMS’ Custom Logs, see HERE.
Once you have completed this step, it make take some time for your data to start showing up in OMS. Give it an hour or so…
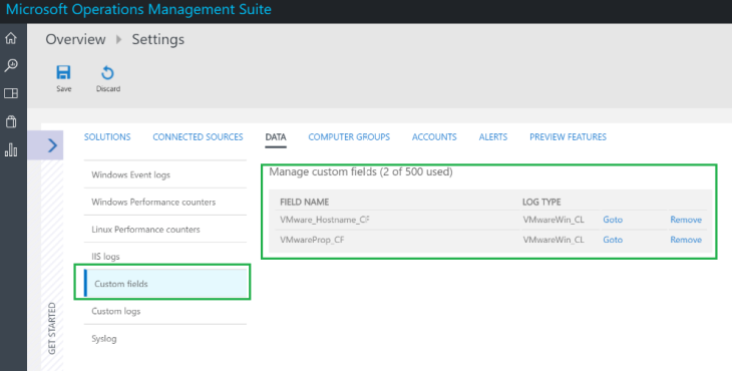
- Now we can start creating some custom fields within OMS. For example, ESXi Hostname, vmkernel, hostd, etc. See HERE about OMS’ custom fields in log analytics.
- If you have done everything correctly, you should have custom logs and custom fields similar to this:
- Now you can start creating some dashboards with some custom queries!
For example, here’s one query I tested with and thought was worthy for its own dashboard:
All events and number of occurrences:
Type=VMwareWin_CL | measure count() by VMwareProp_CF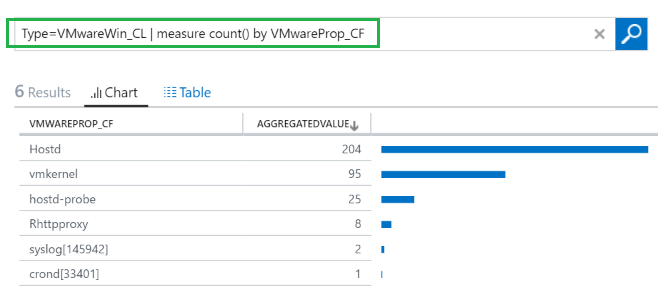
Of course the number of queries and dashboards is endless at this point. Feel free to let me know your thoughts and some queries/dashboards you have come up with!
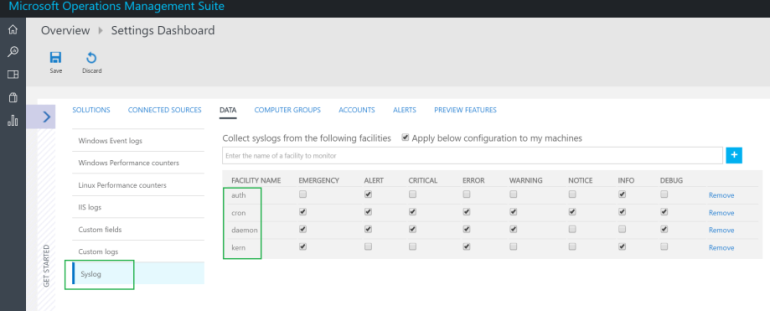
Lastly, don’t forget to add some important syslog OMS Data Log Collection, here is what I have configured:
